Join 3 million developers at
Join 3 million developers at
LEARNING OBJECTIVES
- An understanding of data extraction and preprocessing techniques
- A Hands-on experience in analyzing datasets for different problems using Python
- Develop skills to gather valuable insights from data
- A working knowledge of filtering and refining datasets
- The ability to generate different types of graphs for data visualization
Learning Roadmap
1.
Before We Begin
Before We Begin
Get familiar with Python data analytics, data management, interpretation, and secure storage.
2.
Comparing Wages With Consumer Price Index Data
Comparing Wages With Consumer Price Index Data
Look at analyzing wage trends alongside consumer prices using Python and BLS API data.
3.
Wages and CPI: Reality Check
Wages and CPI: Reality Check
5 Lessons
5 Lessons
Work your way through data integrity, historical context, S&P 500 integration, and growth rate calculations.
4.
Working With Major US Storm Data
Working With Major US Storm Data
10 Lessons
10 Lessons
Apply your skills to clean, analyze, and visualize US storm data effectively.
5.
Property Rights and Economic Development
Property Rights and Economic Development
8 Lessons
8 Lessons
Take a closer look at analyzing GDP, visualizing datasets, and enhancing plots using Python.
6.
How Representative Is Your Government?
How Representative Is Your Government?
4 Lessons
4 Lessons
Tackle analyzing voting data to assess governmental representativeness and party line adherence.
7.
Does Wealth Influence The Prevalence Of Mental Illness?
Does Wealth Influence The Prevalence Of Mental Illness?
4 Lessons
4 Lessons
Analyze relationships between wealth and mental illness prevalence, considering varied trends and data complexities.
8.
Do Birthdays Make Elite Athletes?
Do Birthdays Make Elite Athletes?
3 Lessons
3 Lessons
Try out scraping and visualizing NHL data to analyze birthdate trends among athletes.
9.
Does Literacy Impact The Income of People
Does Literacy Impact The Income of People
4 Lessons
4 Lessons
Solve challenges with analyzing literacy’s impact on global and US state income levels.
Certificate of Completion
Showcase your accomplishment by sharing your certificate of completion.
Complete more lessons to unlock your certificate
Developed by MAANG Engineers
ABOUT THIS COURSE
In this course, you will get an introduction to Python-based data analytics. You will learn the inner workings of Python to the point where you can confidently find and manipulate data sources and use a Jupyter environment to derive insights from your data.
By the end of this course, you will be able to find and clean data sources, plot your data, and use Python functionalities that show graphs of data.
It’s your all-in-one guide to teaching yourself data analytics in 30 days.
ABOUT THE AUTHOR
David Clinton
Linux system administrator, AWS solutions architect, data analyst, book and courseware author
Trusted by 3 million developers working at companies
A
Anthony Walker
@_webarchitect_
E
Evan Dunbar
ML Engineer
S
Software Developer
Carlos Matias La Borde
S
Souvik Kundu
Front-end Developer
V
Vinay Krishnaiah
Software Developer
Built for 10x Developers
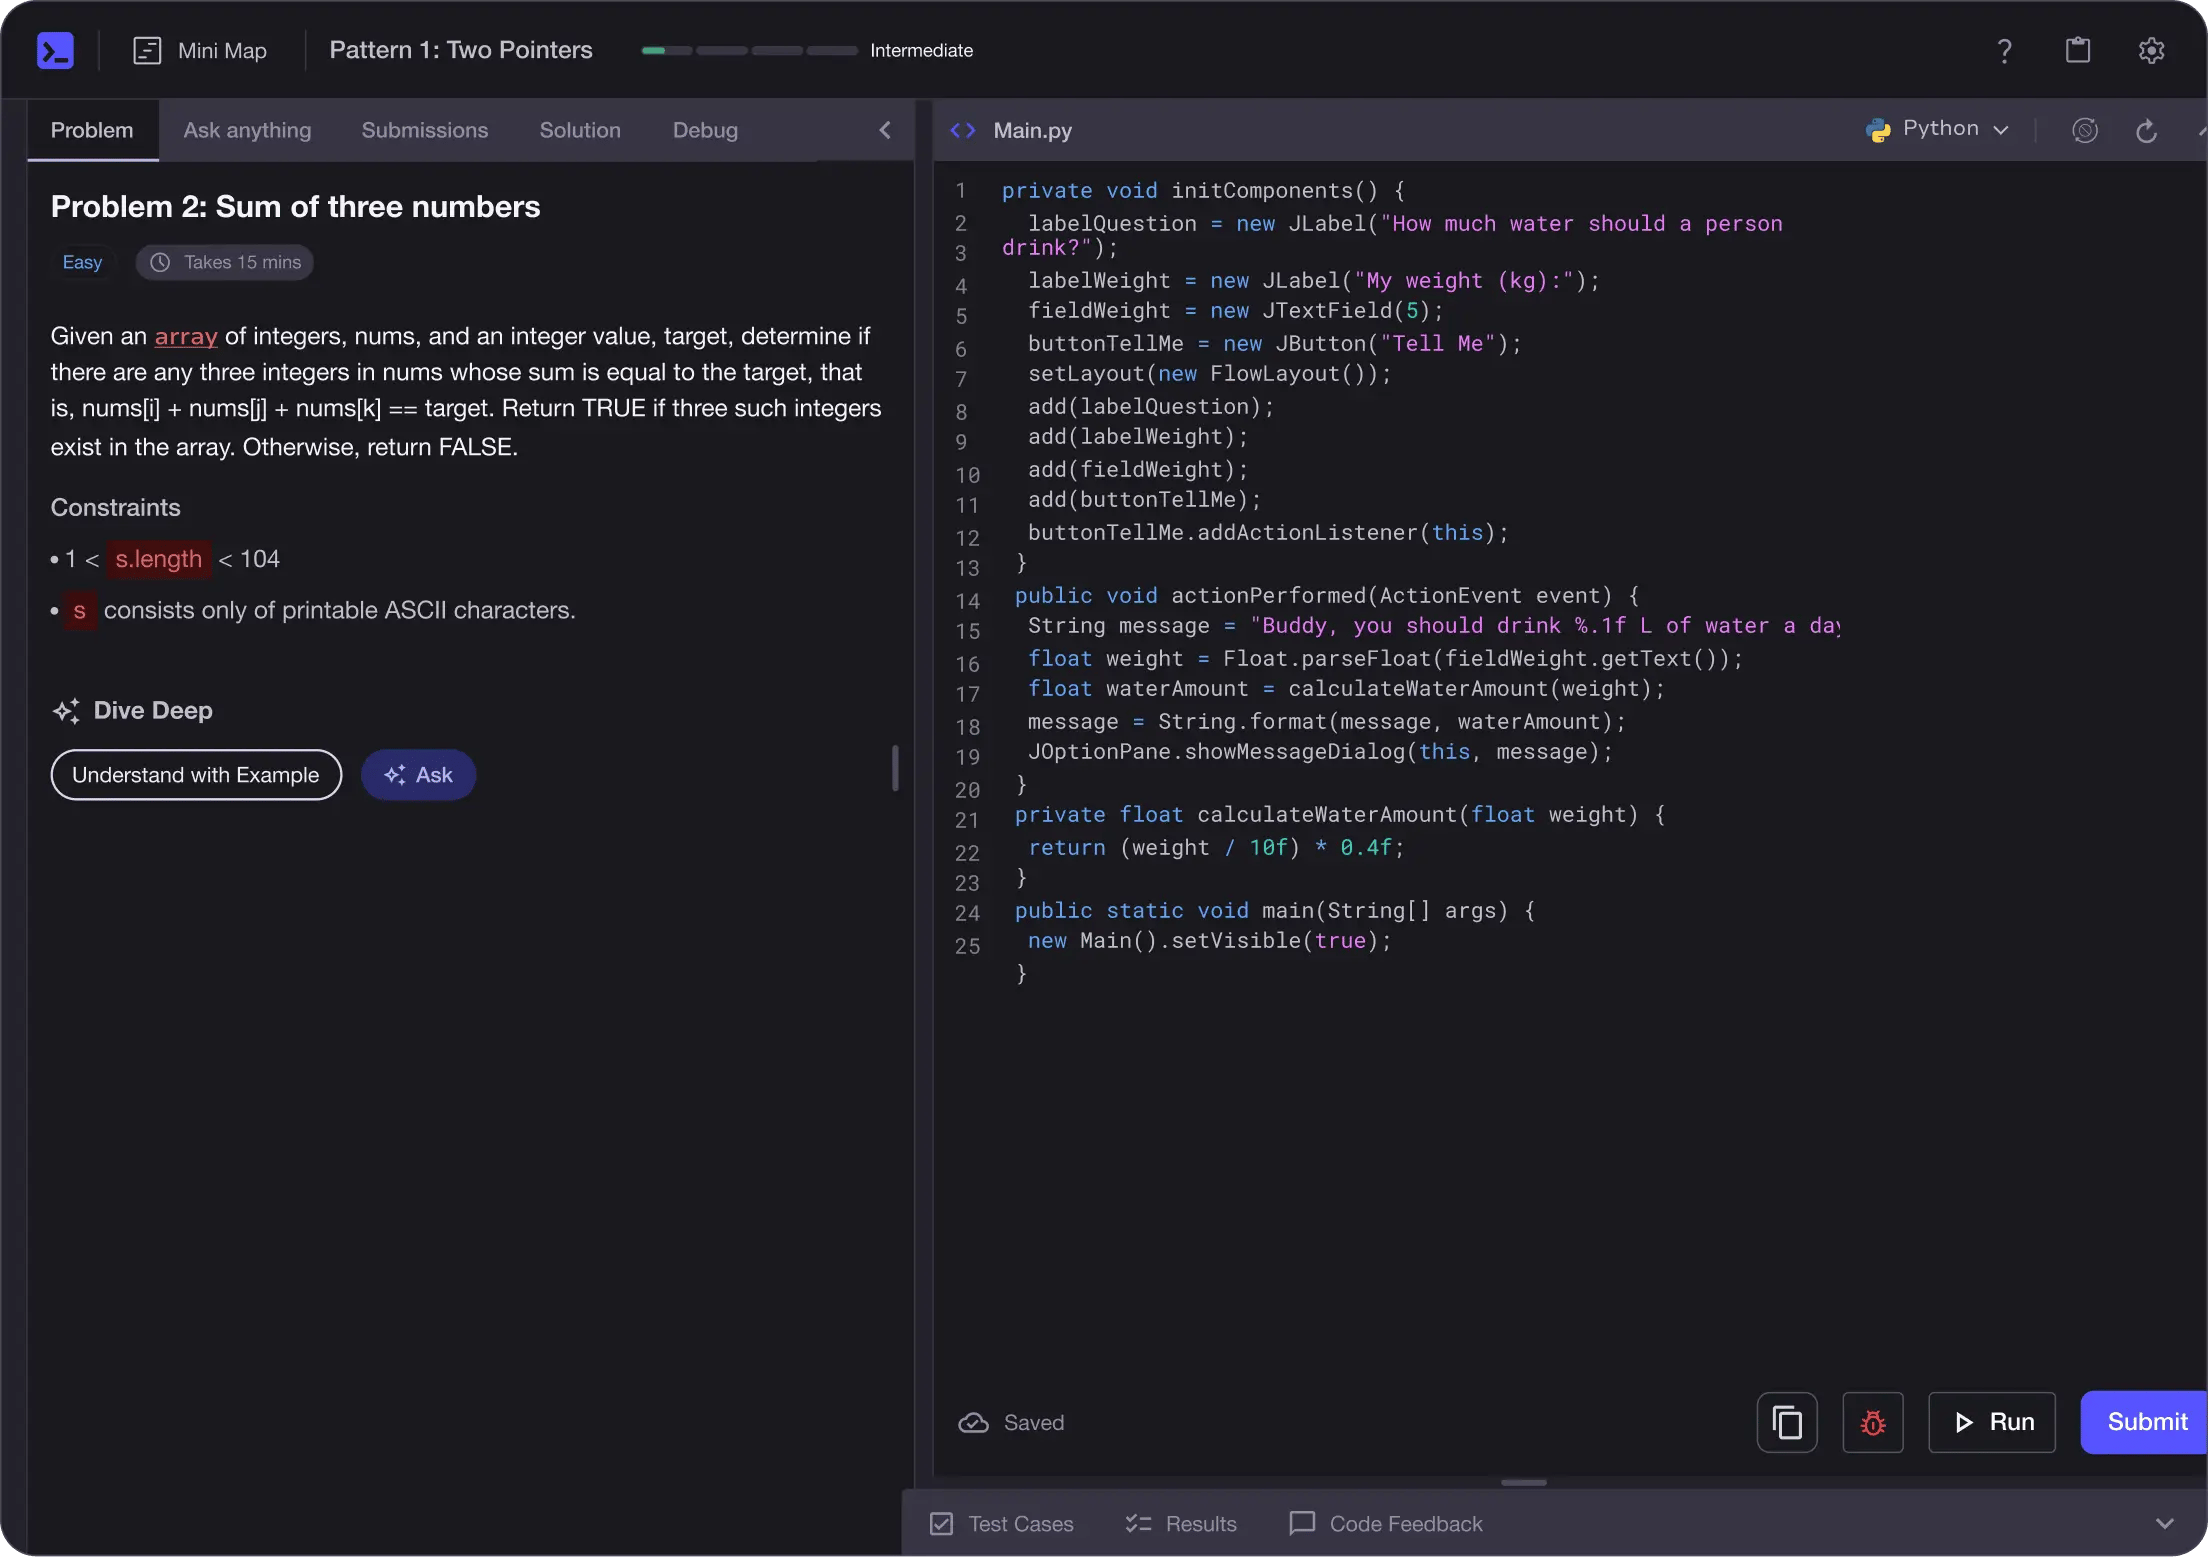
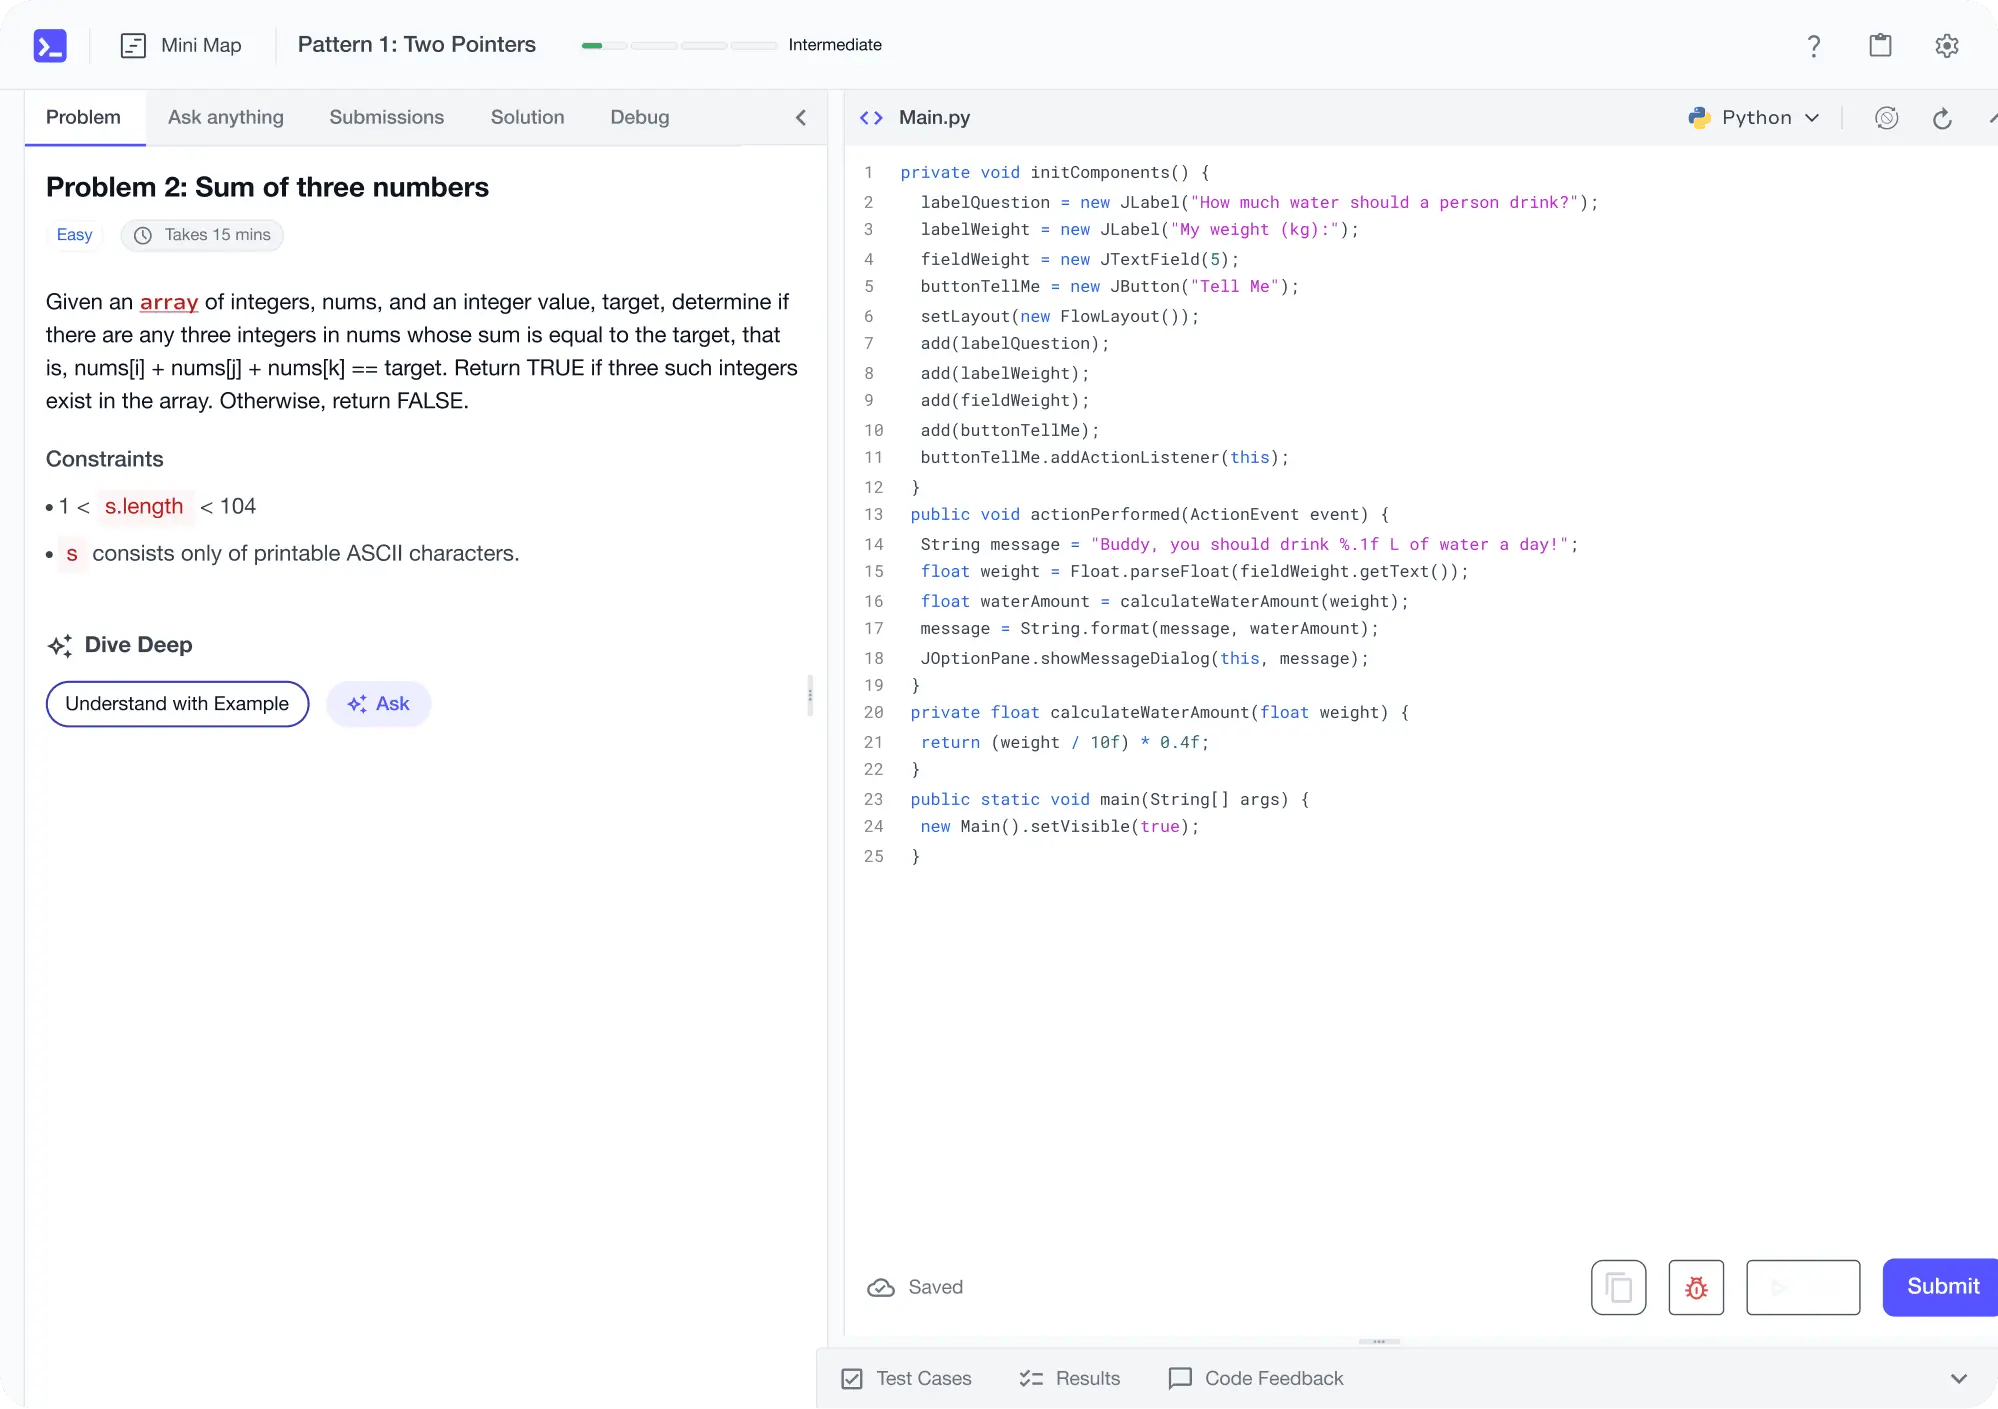
No Passive Learning
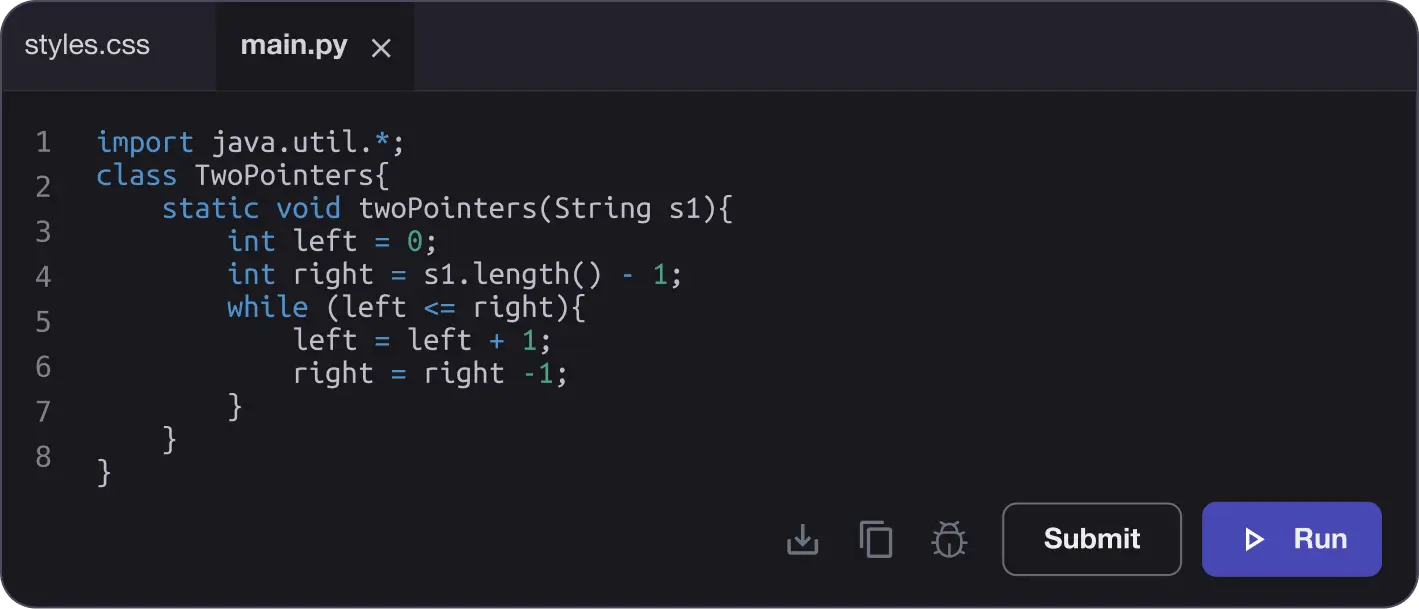
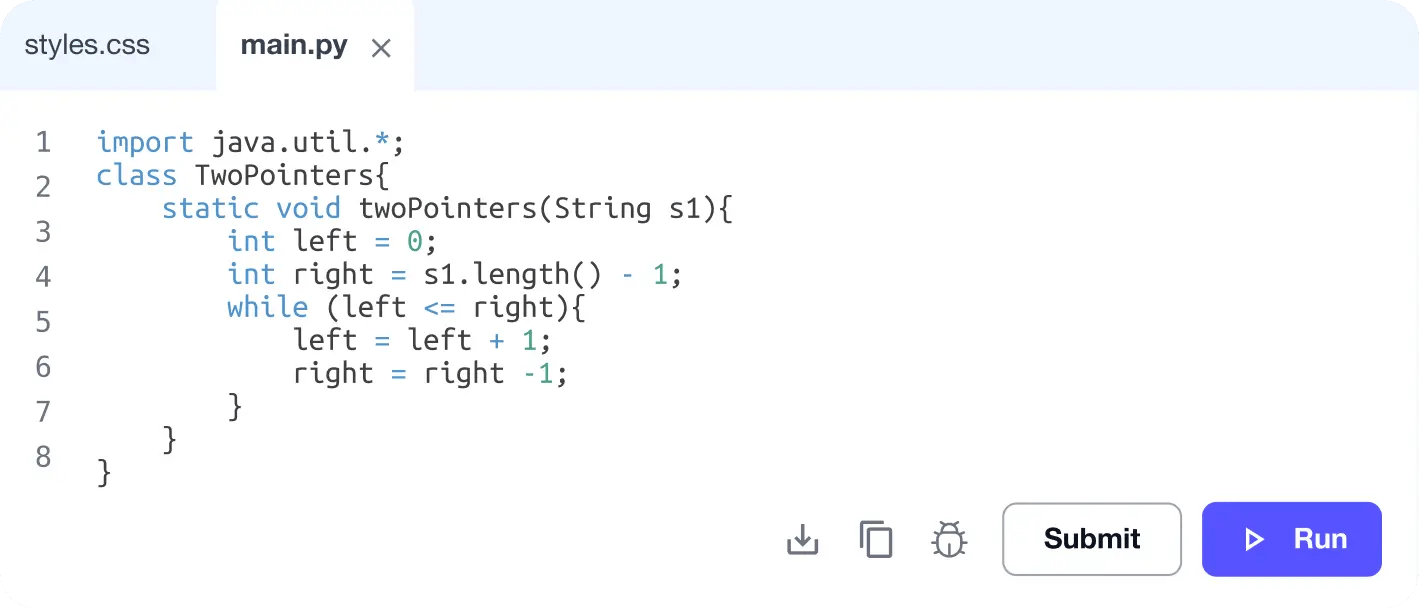
Learn by building with project-based lessons and in-browser code editor
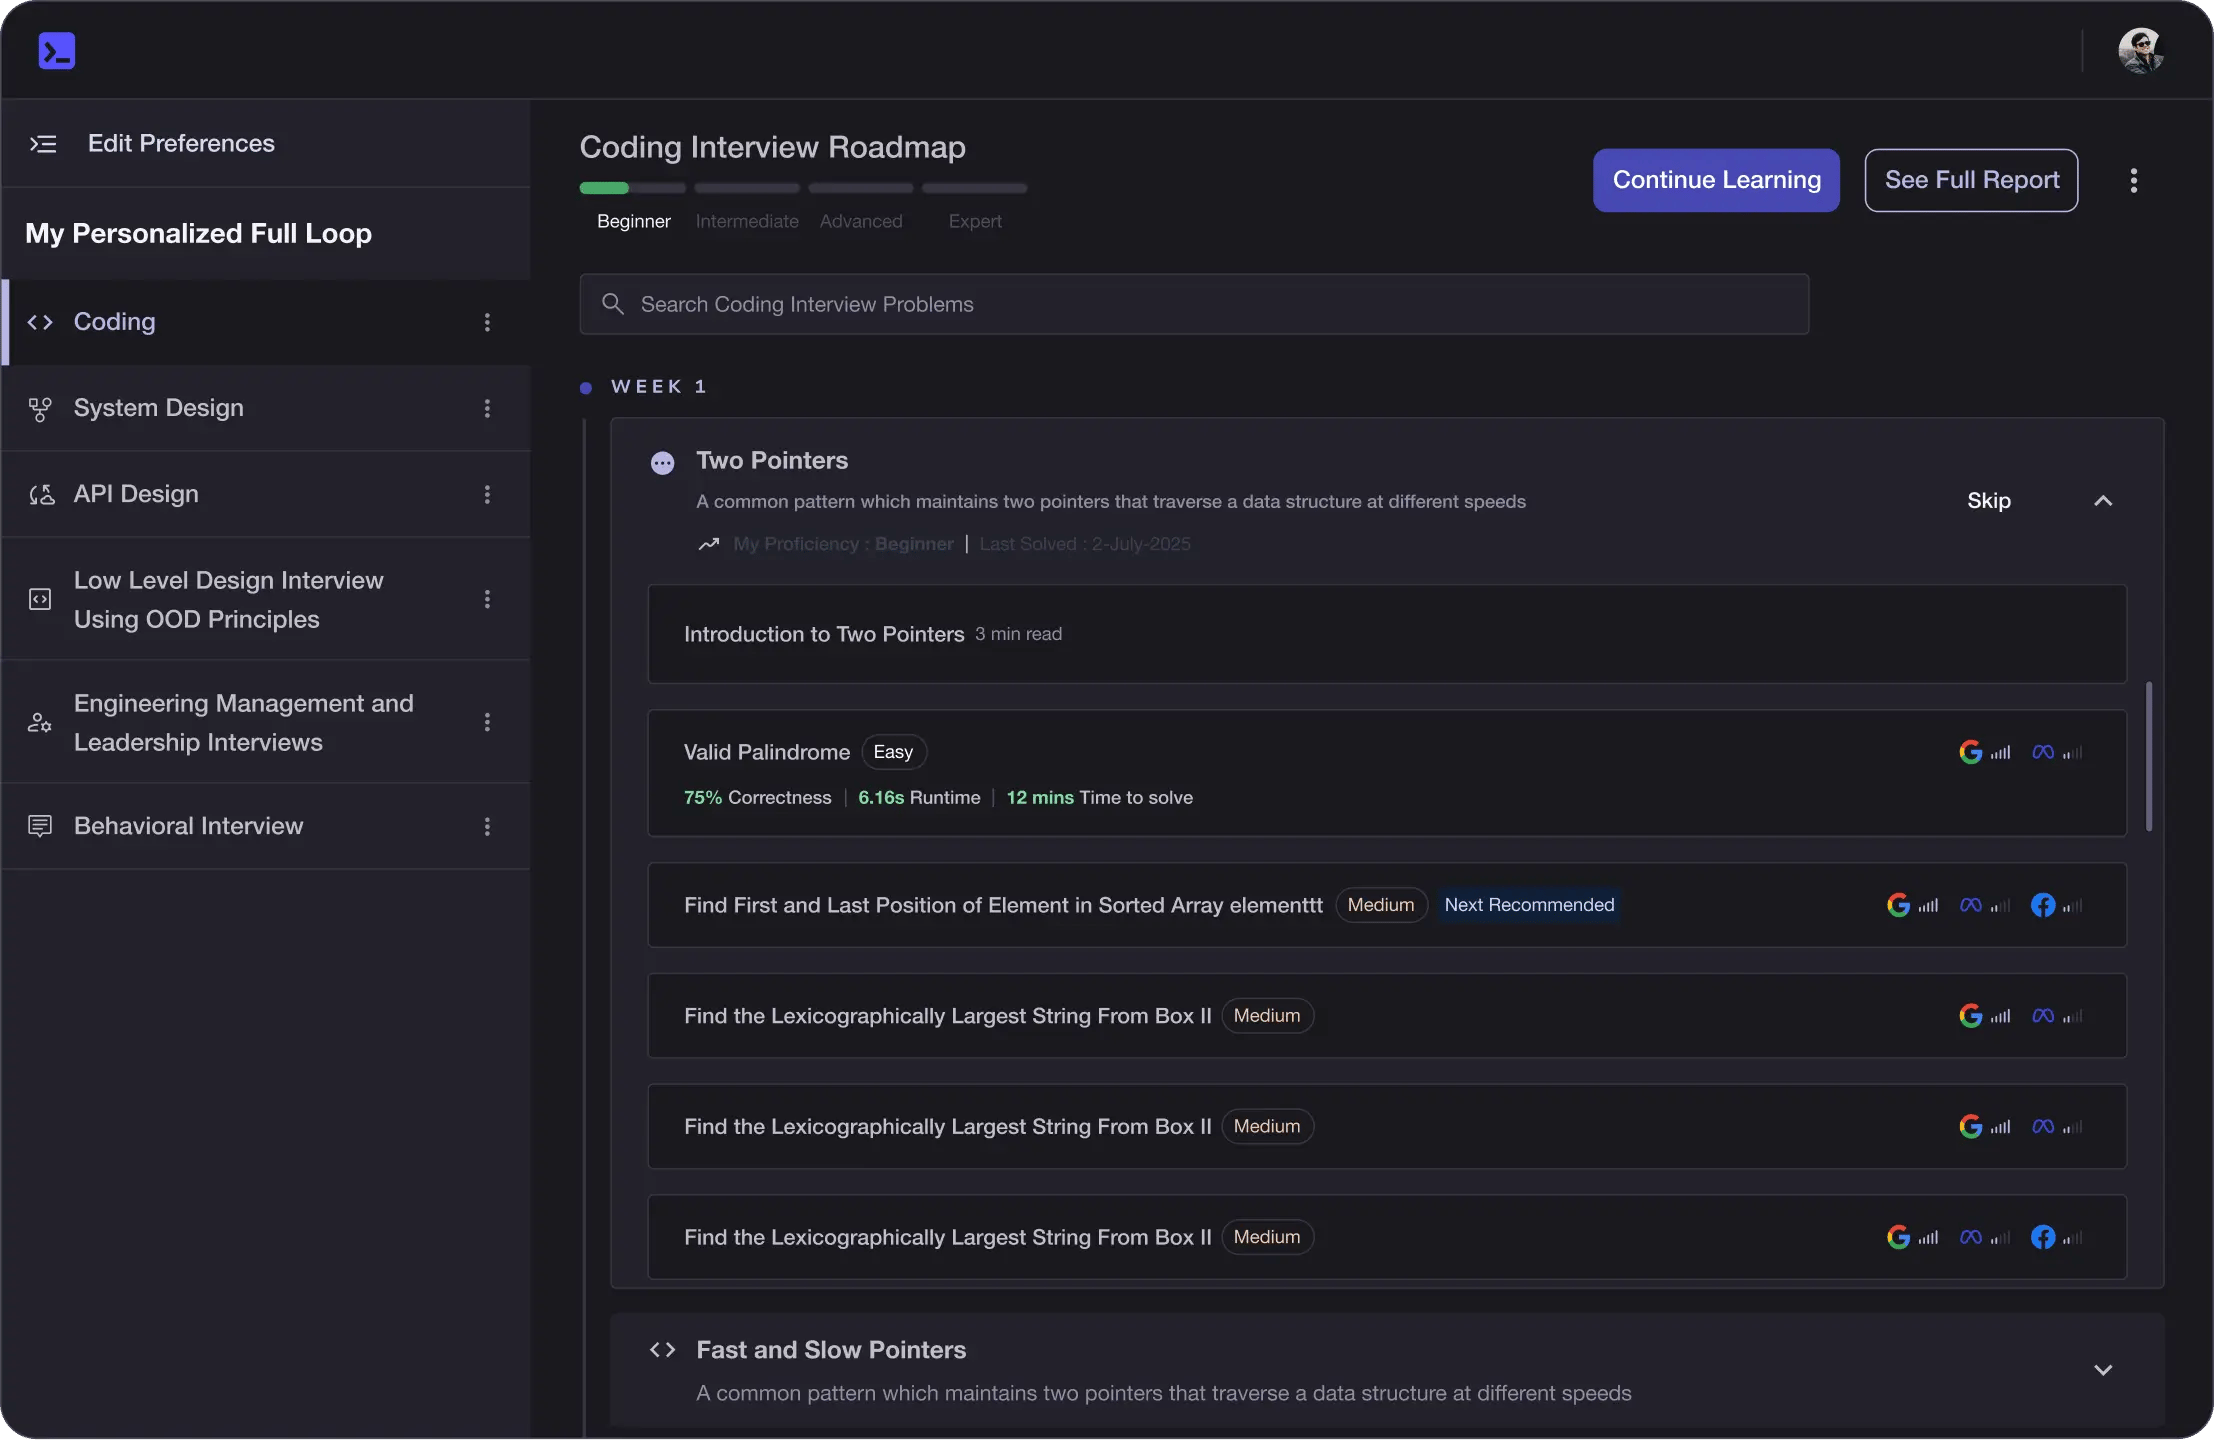
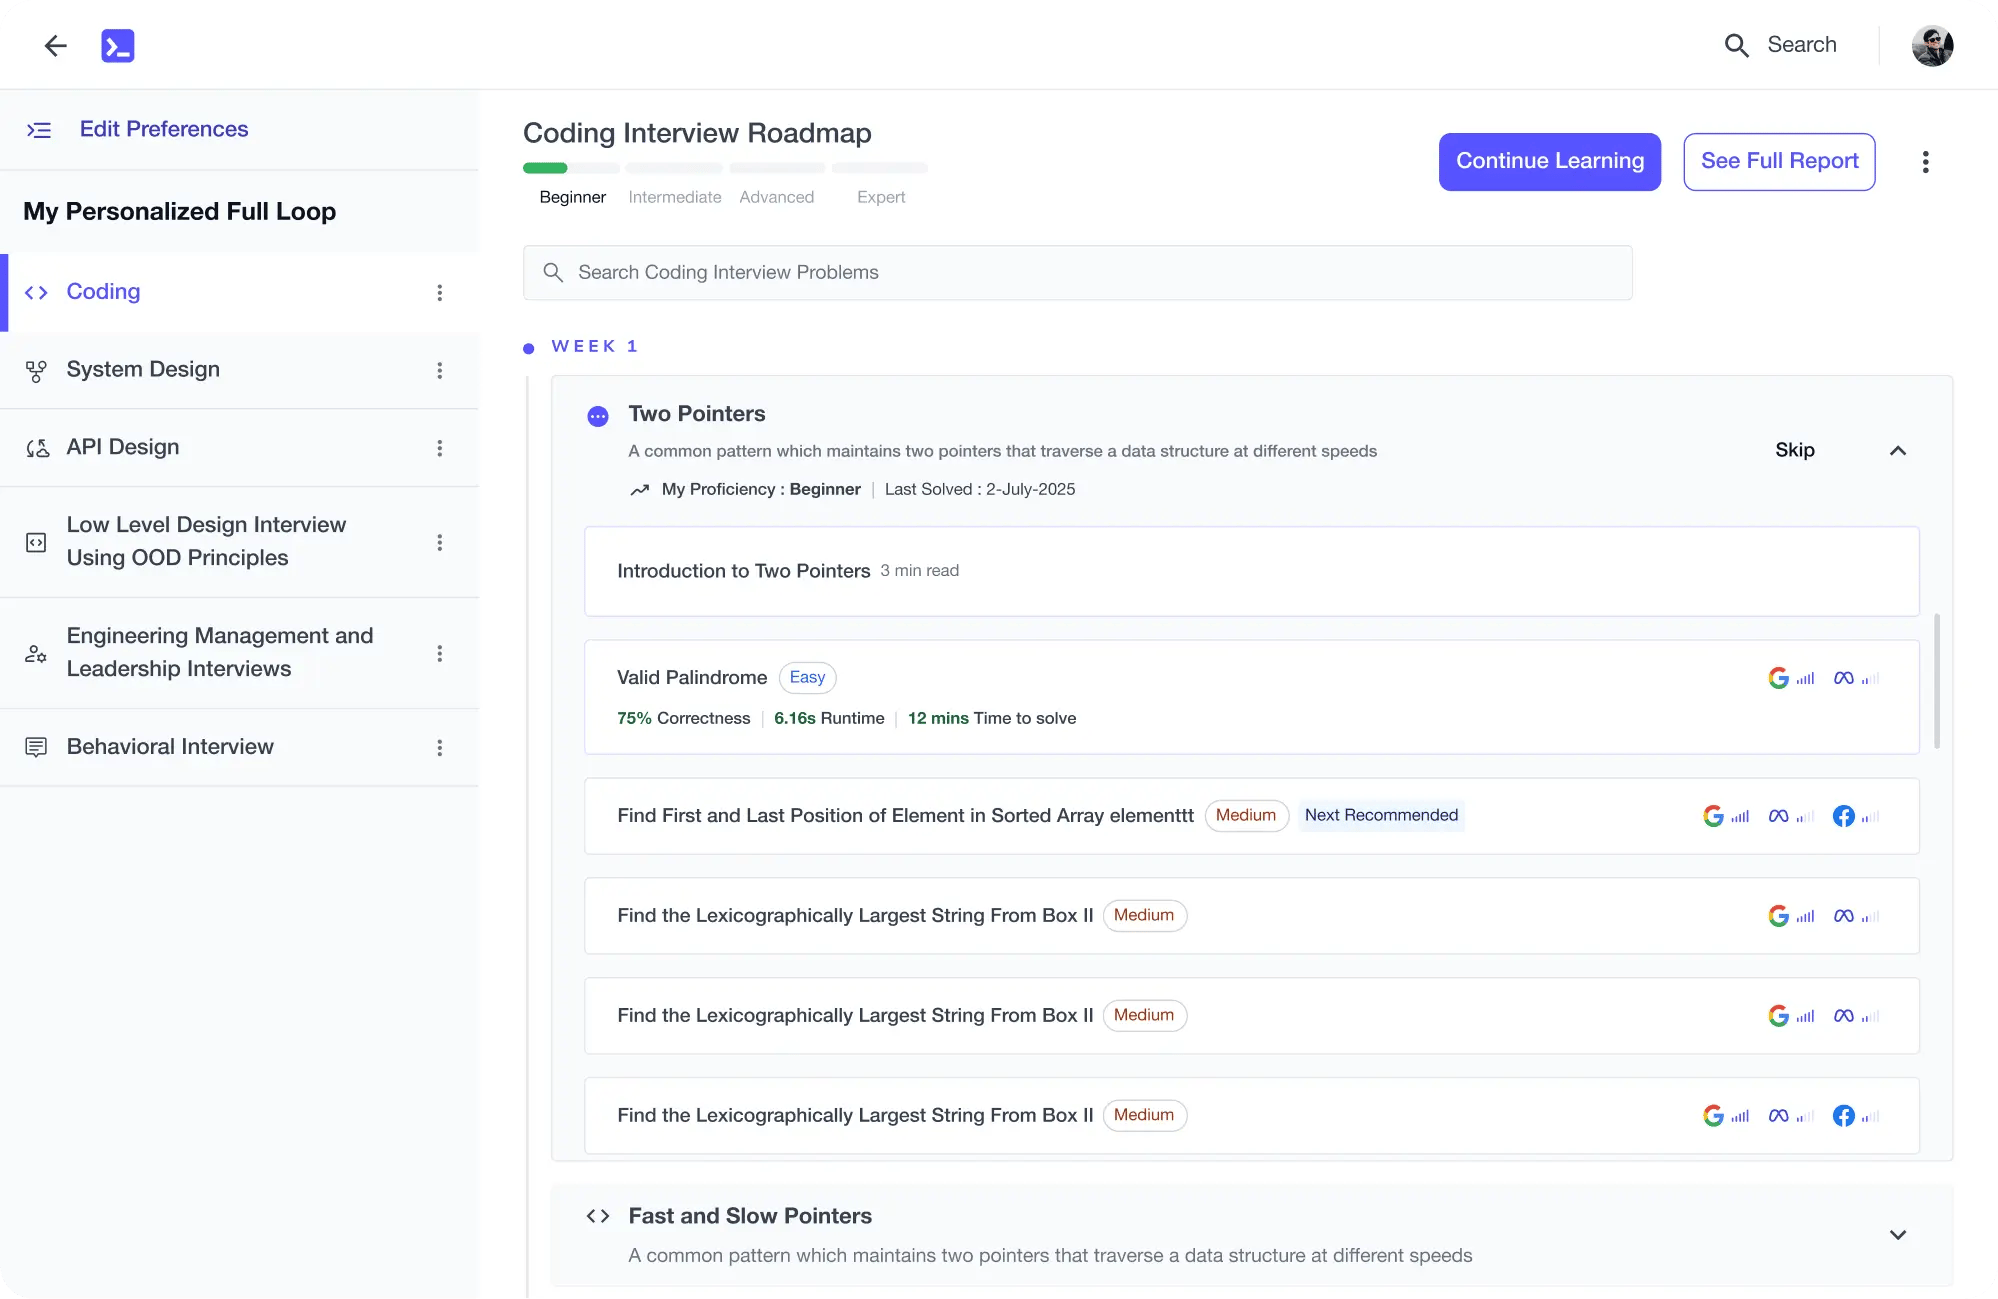
Personalized Roadmaps
The platform adapts to your strengths & skills gaps as you go
Future-proof Your Career
Get hands-on with in-demand skills
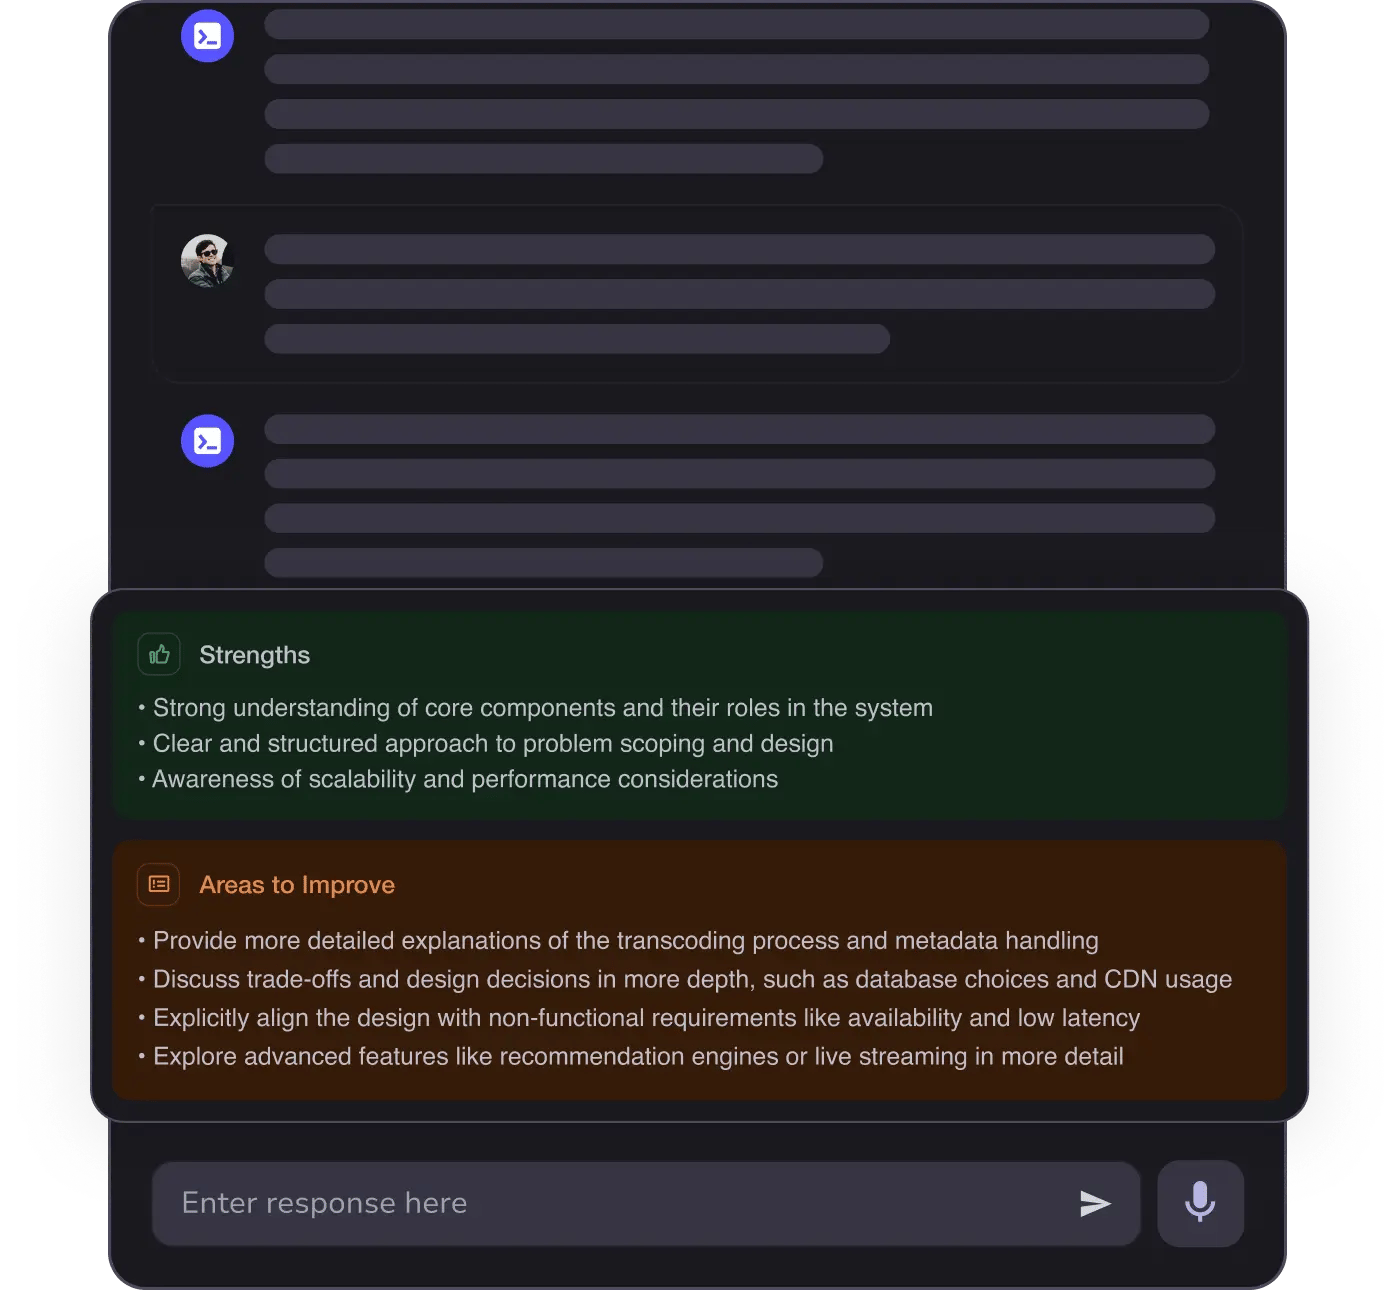
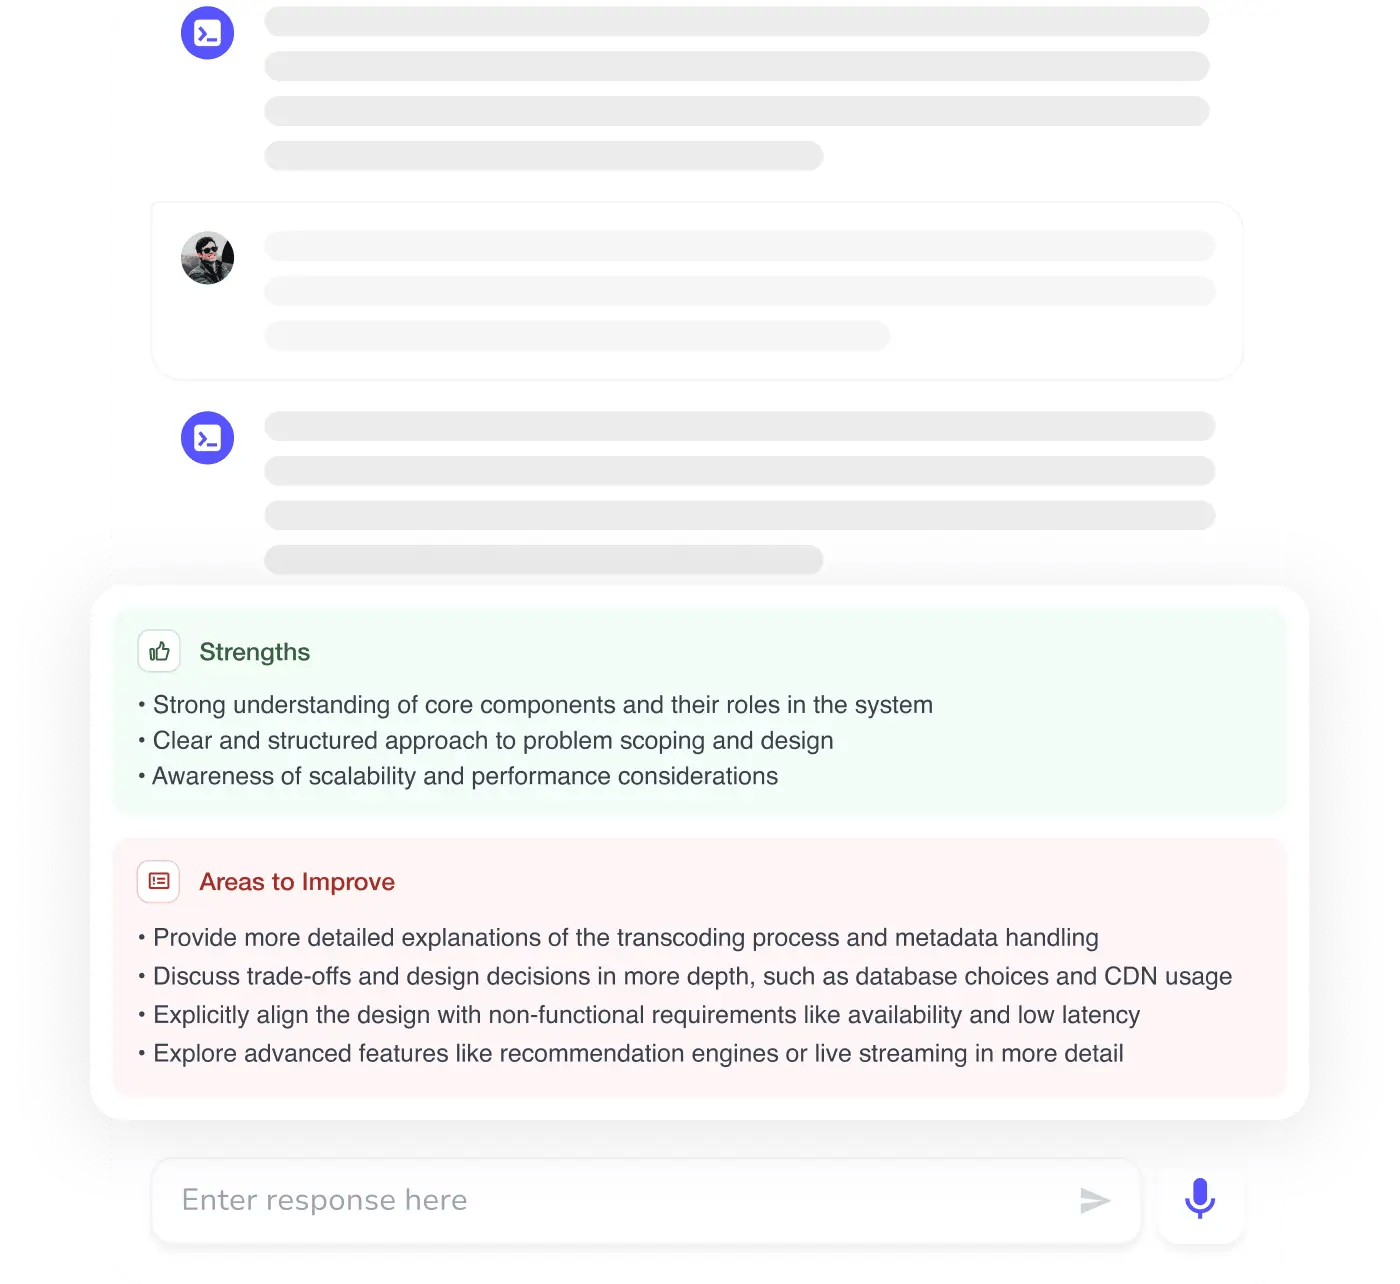
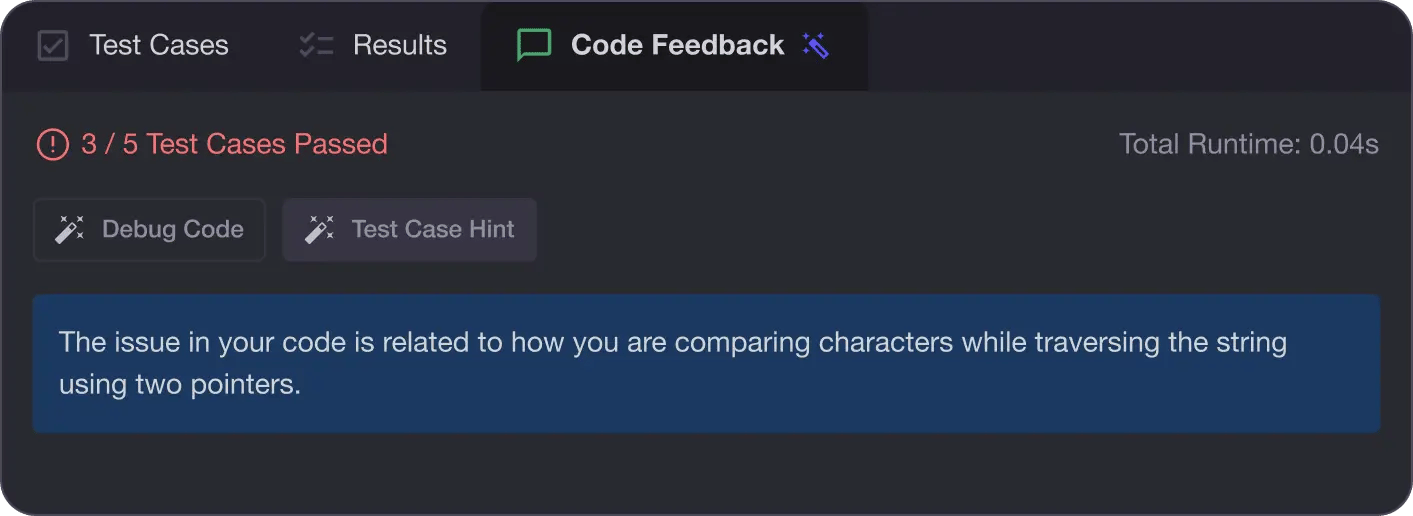
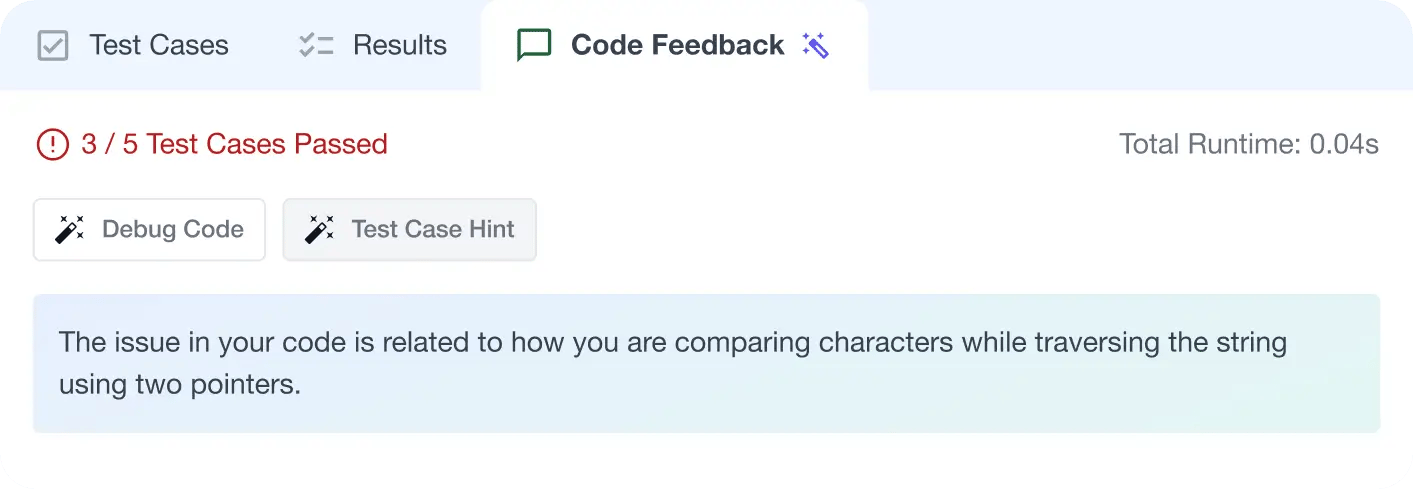
AI Code Mentor
Write better code with AI feedback, smart debugging, and "Ask AI"
MAANG+ Interview Prep
AI Mock Interviews simulate every technical loop at top companies